Case study · Sorba.ai · AI Trainer
Preparing data
for machine learning.
Designing for ML practitioners: dataset versioning, data quality and recovery states in an AI training platform.
01Problem
One flow, many settings.
Sources, dates, fields and versions share one flow.
02Decision
New forms, redesign proposed.
The redesign makes versions, quality and recovery states visible.
03Result
Live in the demo
Dataset forms are live; the redesign is a proposal.
ConstraintNo direct access to customers. Feedback came from developers and the e-commerce team; usability tests are the next step.
Context
Making a technical setup easier to follow.
AI Trainer, formerly ML Trainer, is the part of Sorba’s platform where people prepare and version their data, create projects to analyse it and build models. Everything starts with a dataset, so this case follows that part of the product.
The project took about four months, and I was its only product designer. Parts of the product are under NDA, and many early files were not saved. This case presents a selection of surviving Figma screens with a retrospective account of the work.
My contribution
- Redesigned many of the forms and created new forms and flows that are in the product now: CSV and XLSX import, aggregation, per-field settings, rules and a hot-data source.
- Proposed a redesign with a new visual style: stronger contrast, more generous spacing and colour applied consistently to every element.
- Proposed new layouts for the overview, dataset list, versions, explorer and warnings.
Working with developers gave me the system and its technical limits. The surviving files do not show a complete iteration history, so “OLD” and “v1” labels do not establish sequence or approval.
Overview · redesign proposal
A home that shows the state of your data.
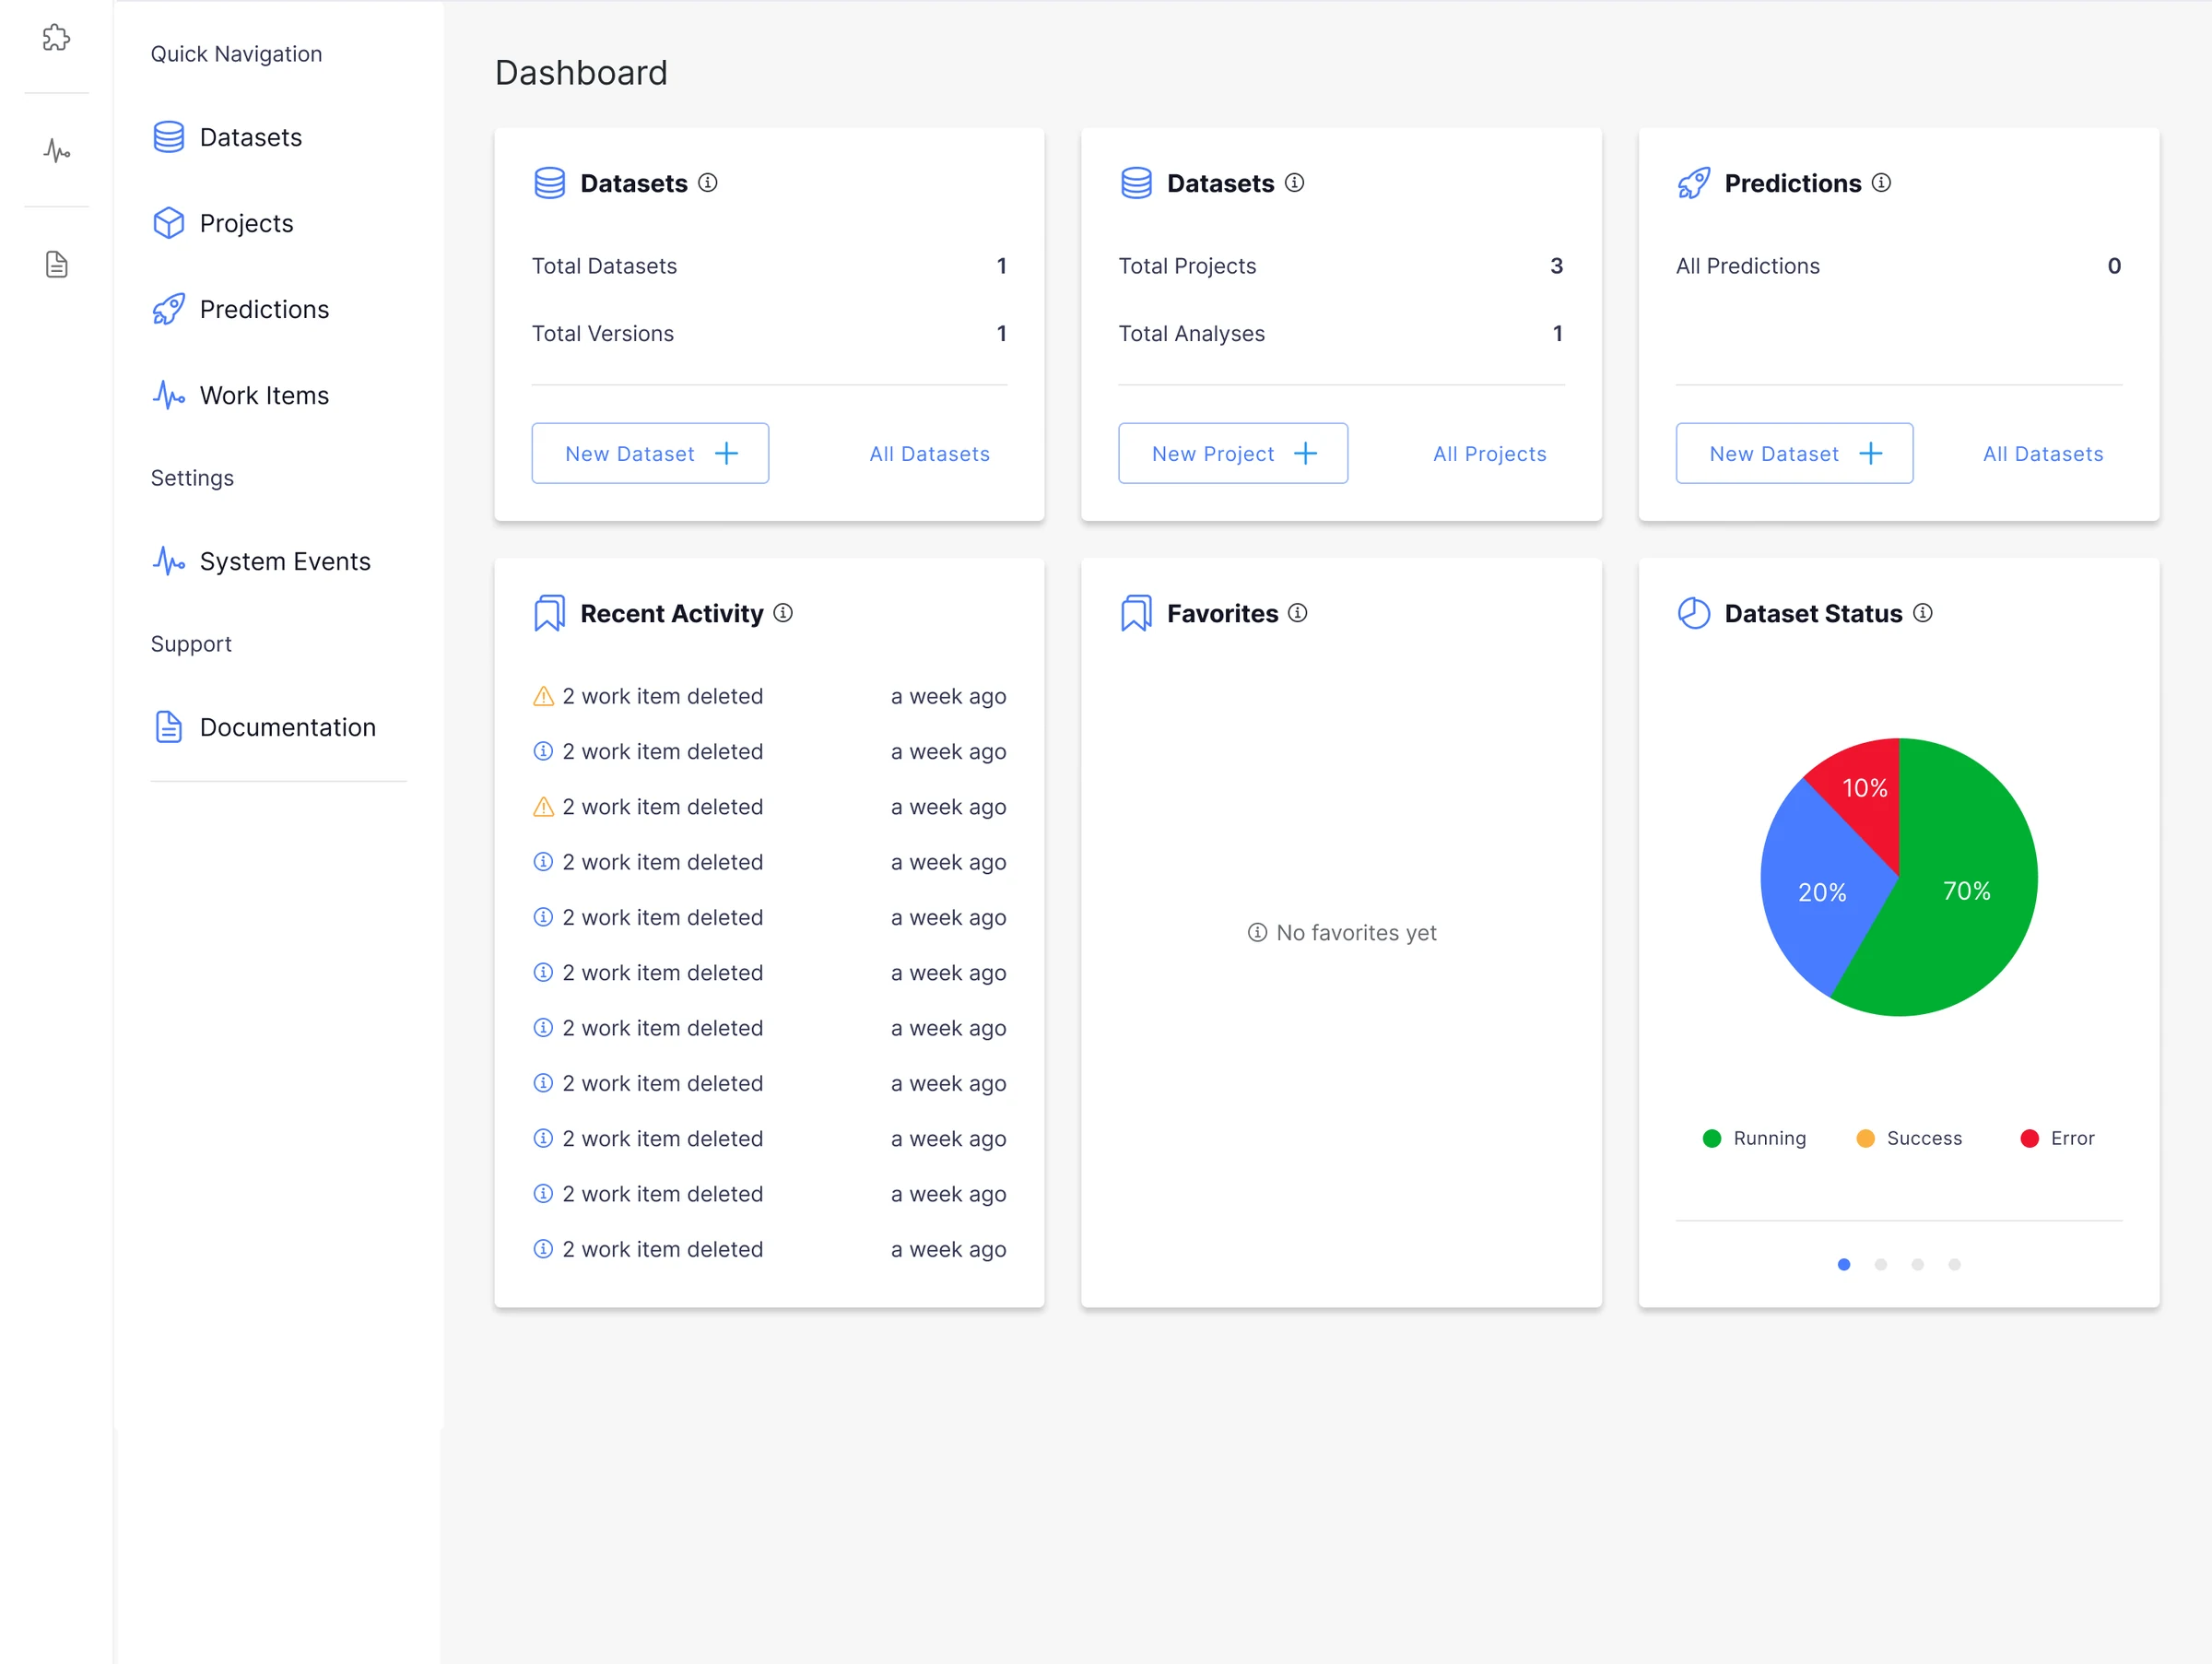
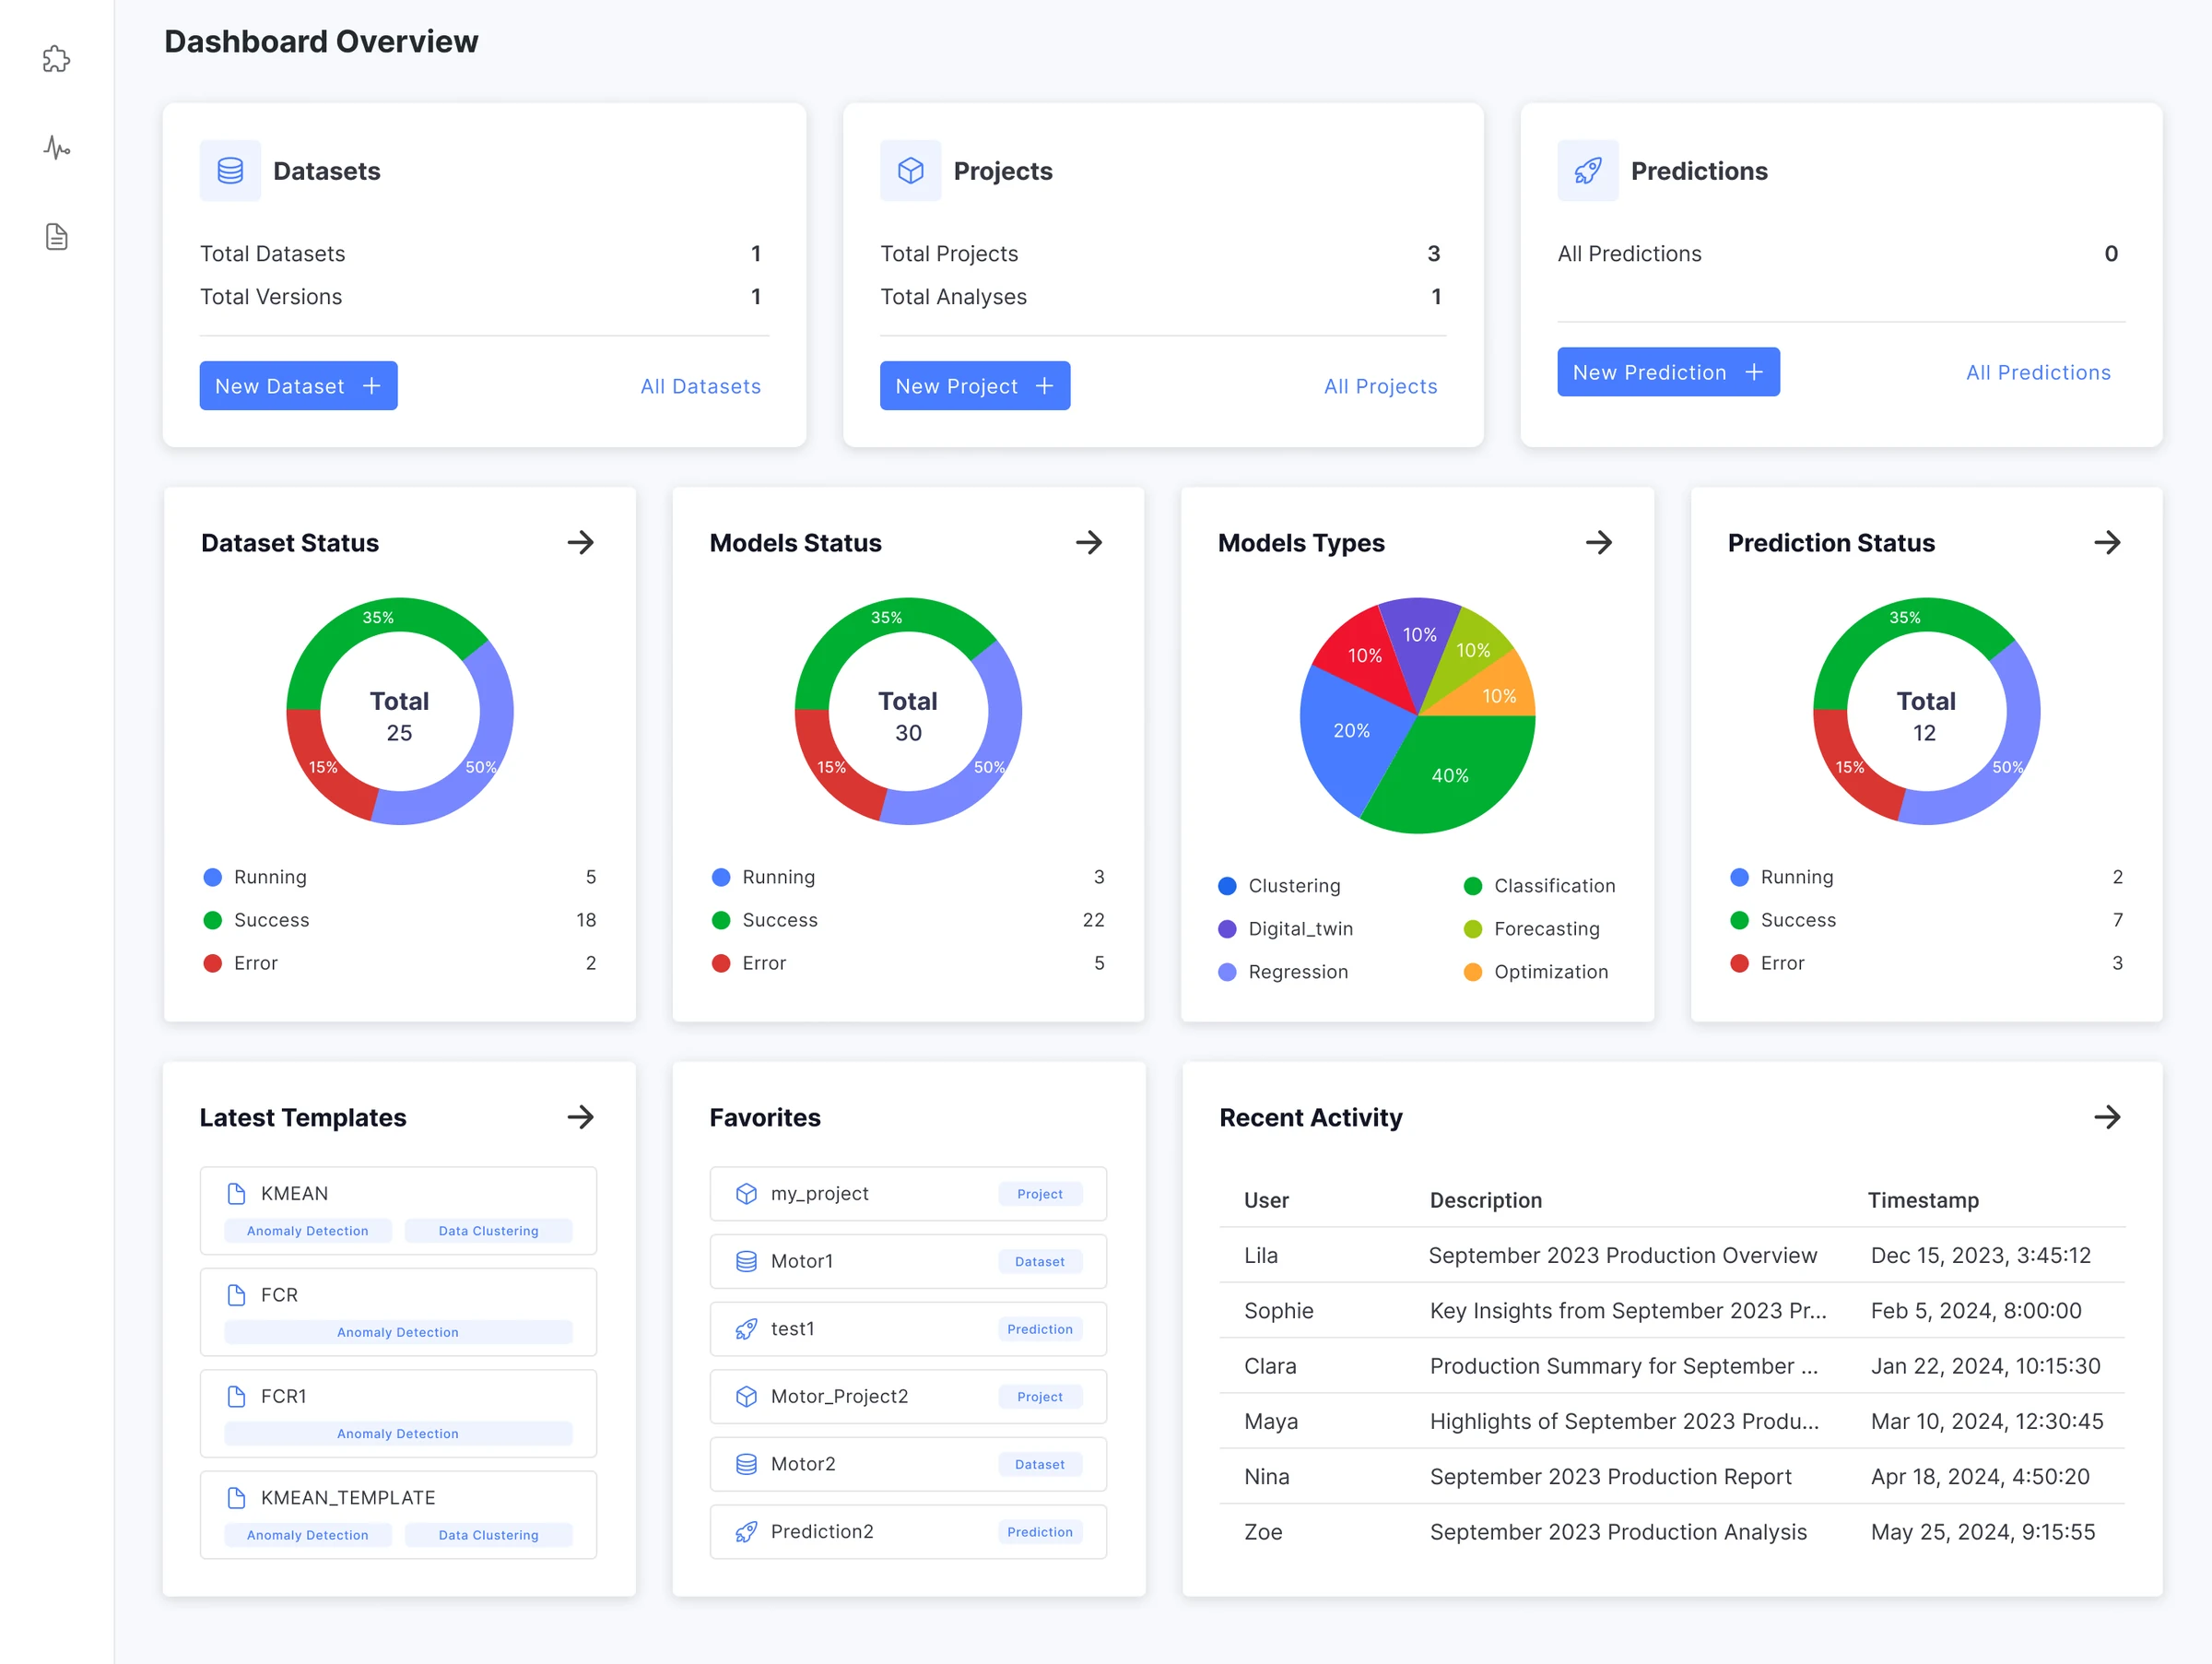
The overview in the product duplicates navigation and labels the Projects card “Datasets”; its Predictions card also uses dataset actions. My proposal removes the extra navigation column, gives each object its own labels and actions, and places status summaries below.
Open the full overview in the product · Open the full redesign proposal
In the product
A quick-navigation list beside the side rail, two cards titled “Datasets”, a Predictions card with a “New Dataset” button and repeated activity rows.
Redesign proposal
Object-specific actions above status charts, templates, favorites and activity. Chart counts and percentages are inconsistent placeholders in the saved design, not product metrics.
Three decisions in the proposal
The proposed overview has more content and is taller. I am not claiming it reduces scrolling or time to task.
Visual style · redesign proposal
One look for every element.
Alongside the flows, I defined a new visual style for AI Trainer, with stronger contrast, more generous spacing and consistent colour roles across interface elements.
The proposed overview above shows it: solid primary buttons, icon tiles on the summary cards, donut charts with counts in their legends, and a table for activity. The product’s overview uses outlined buttons and simpler cards.
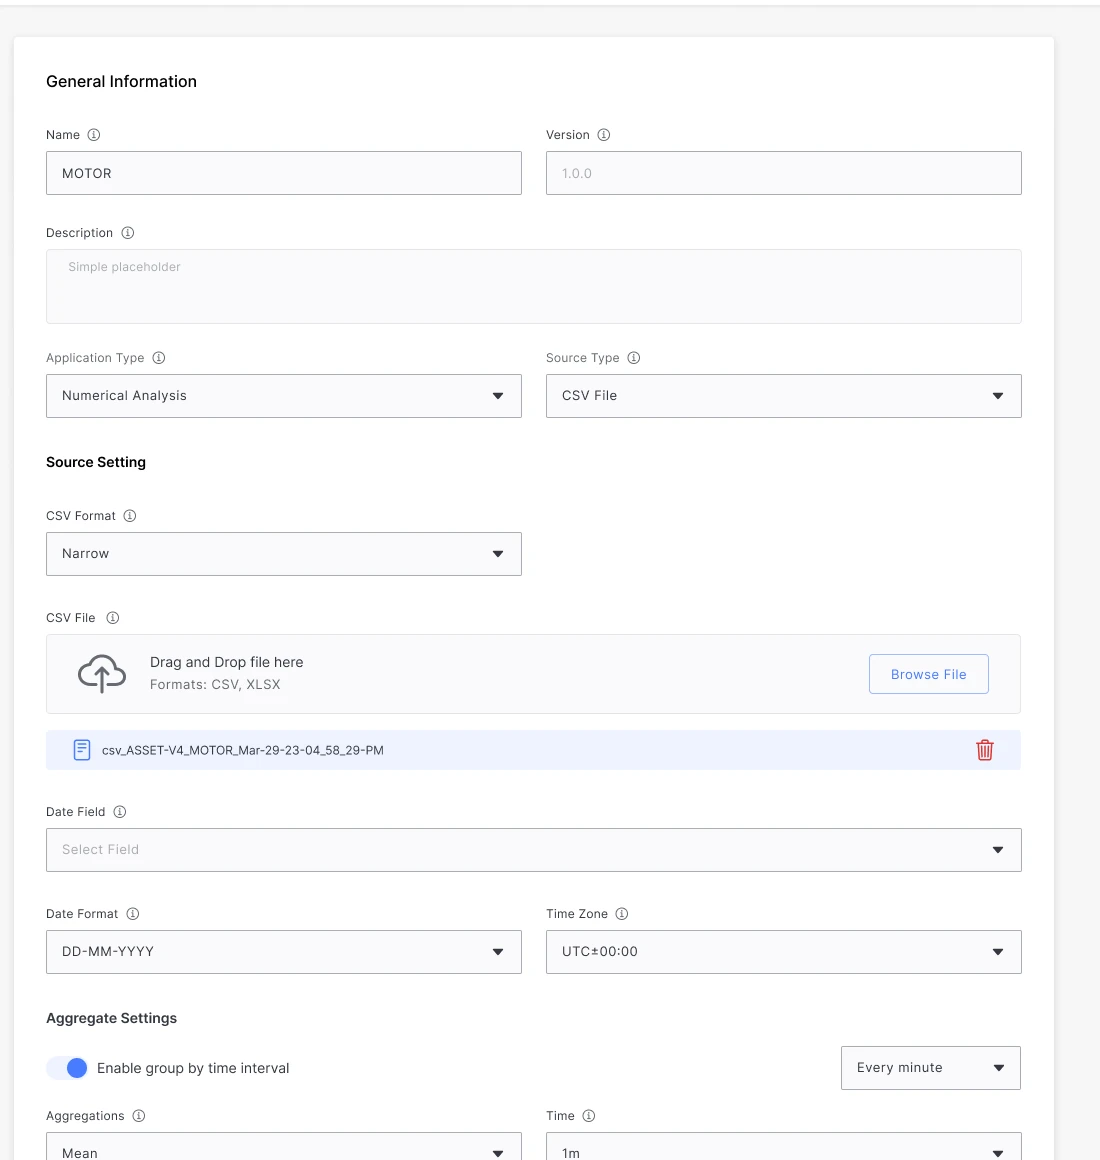
The form in the product
Earlier visual style.
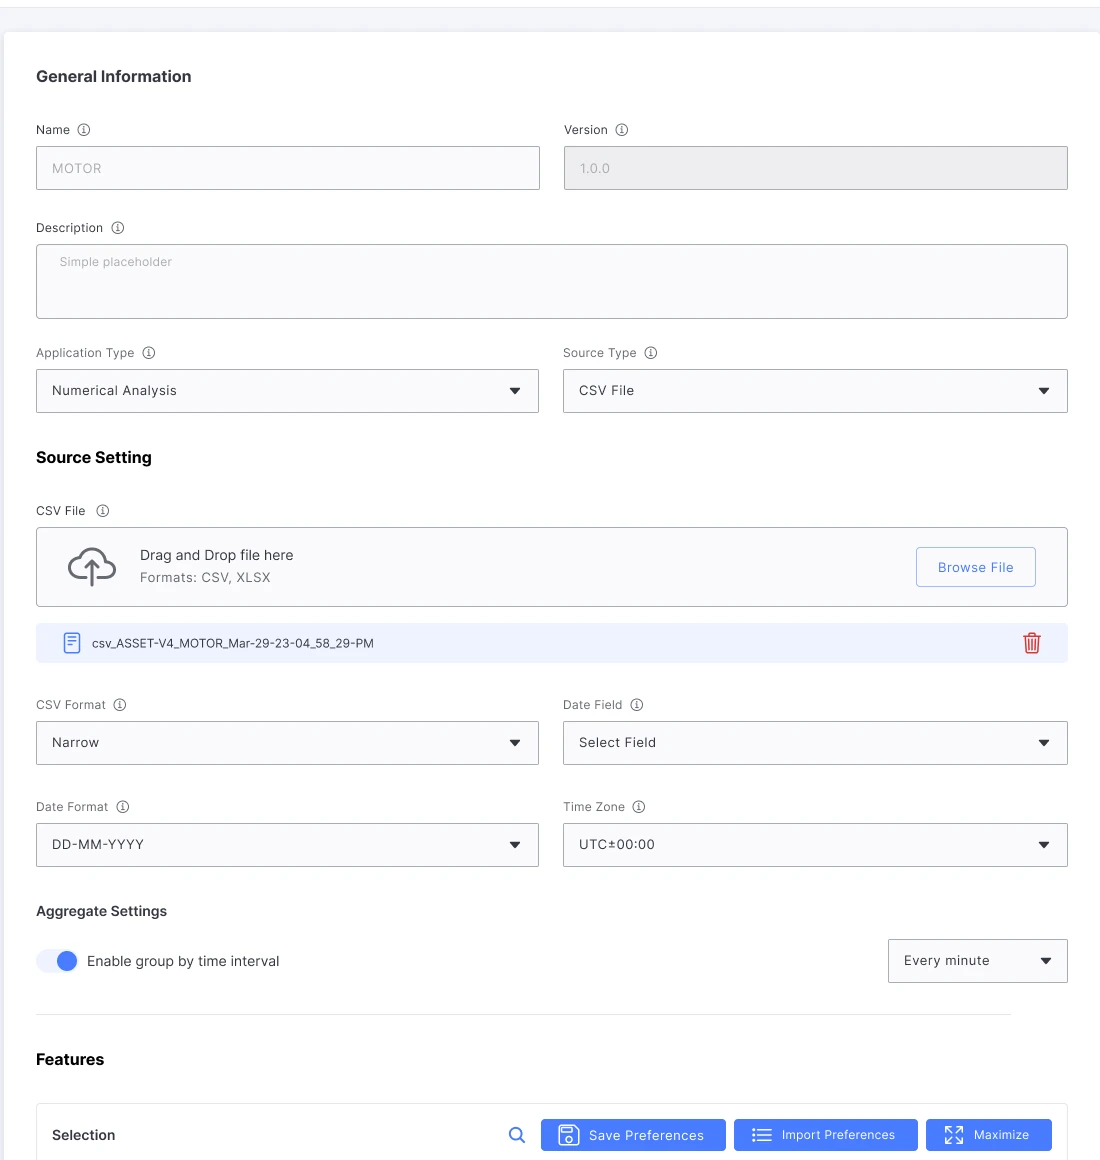
The same form, redesigned
Proposed visual style. The form keeps its structure; the style shows most in the overview.
The dataset flow
From a data source to a dataset version.
This retrospective map connects the tasks represented in the saved designs. It is not a verified navigation sequence; configuration includes source settings, field operations and rules.
Dataset module · reconstructed task map
- Dataset list
- New dataset: source, fields, rules
- Versions
- Version properties
- Explorer
Each step exists in the product, in the earlier visual style.
The redesign changes the style and layout of these screens; it is a proposal.
Dataset forms · in the product
Forms that handle real files.
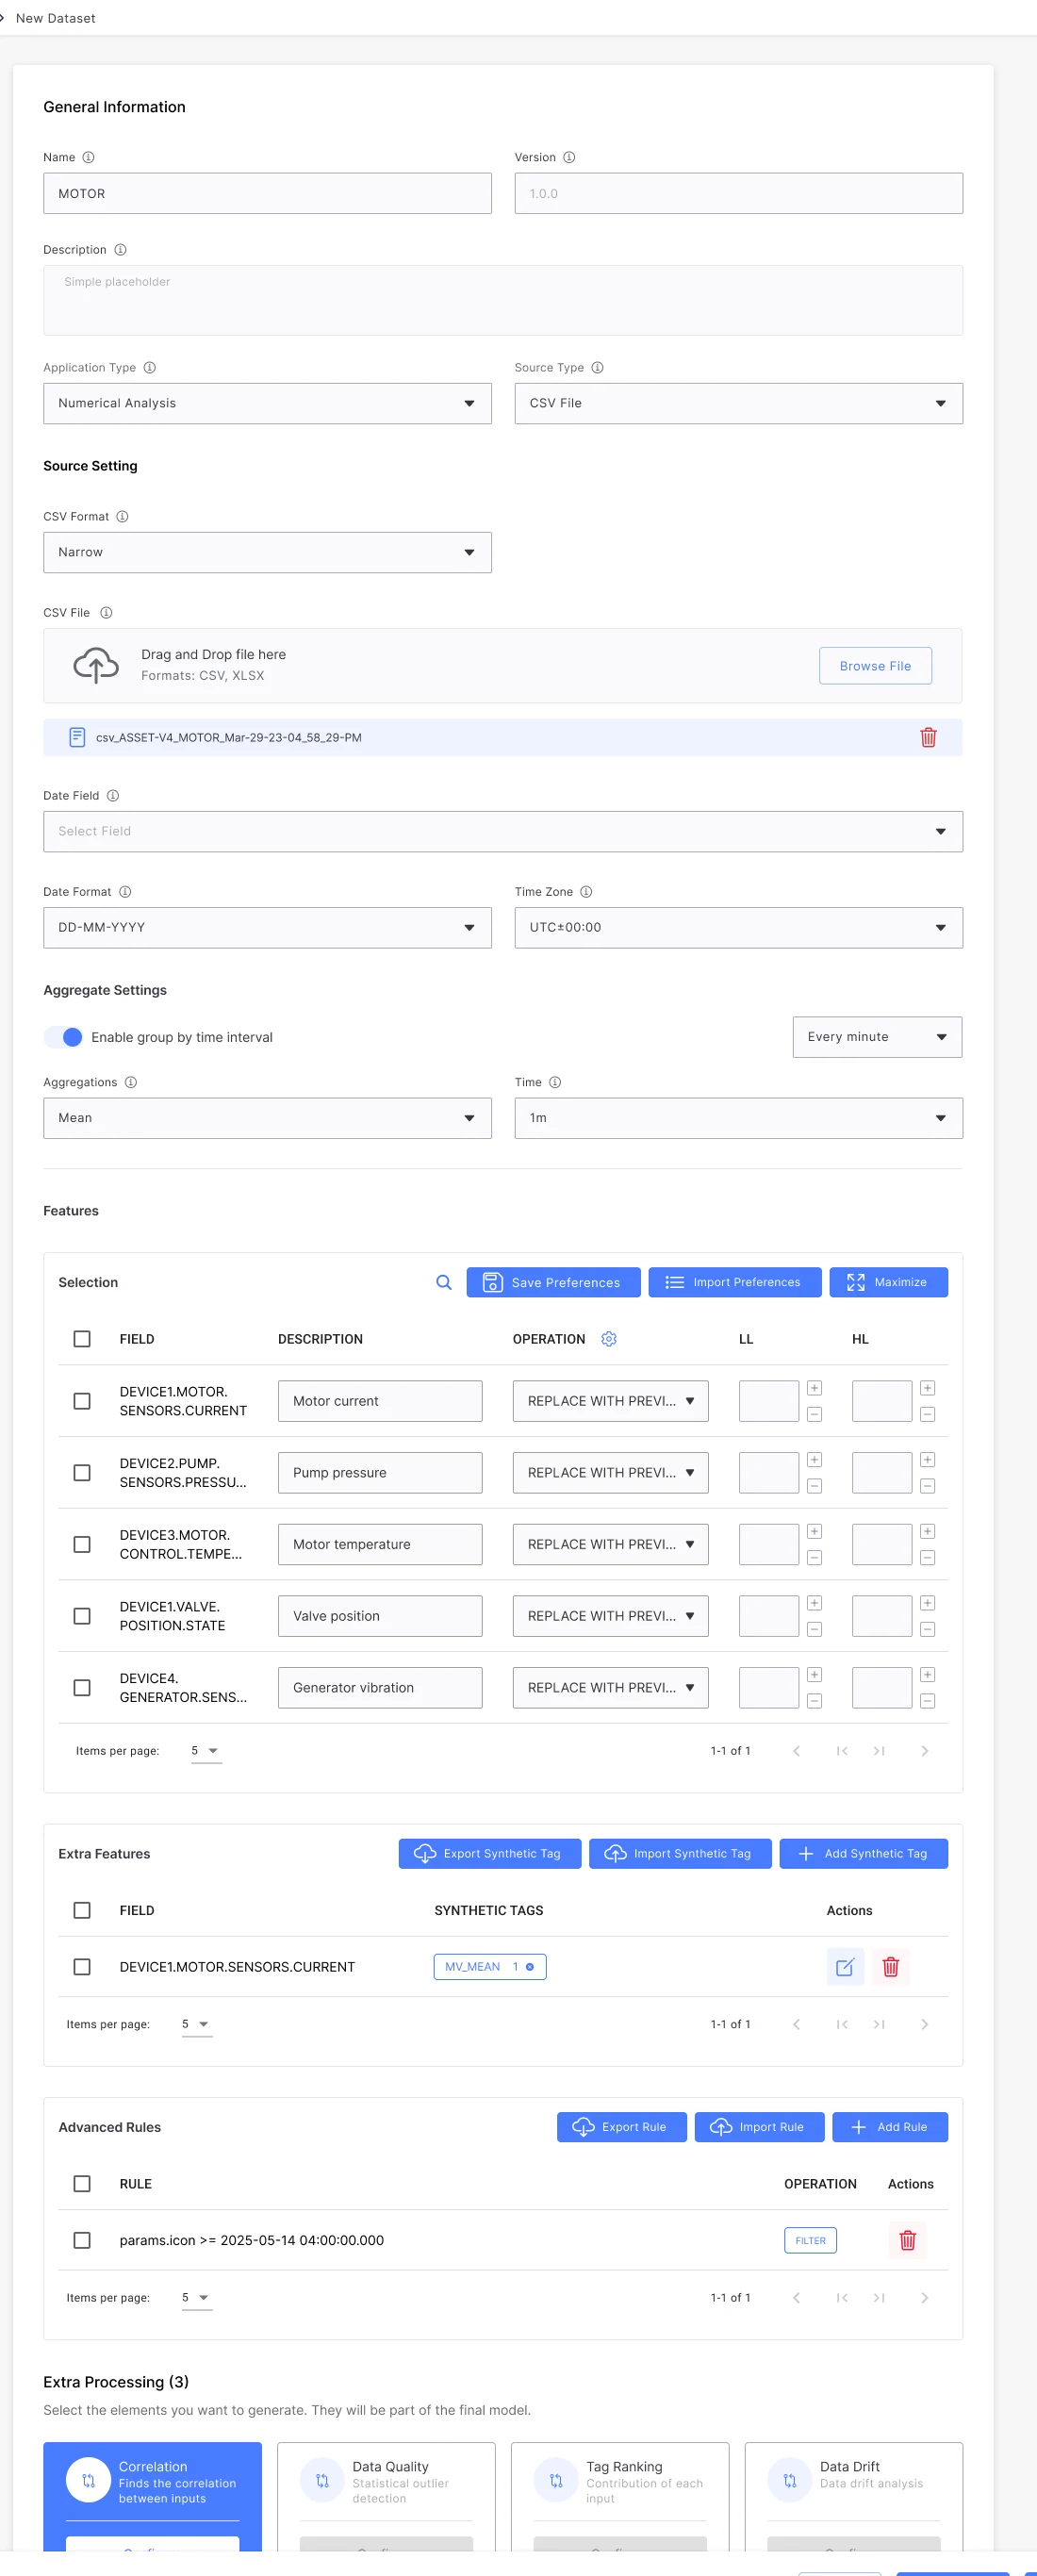
An earlier saved form shows a CSV field labeled “Only .zip files are allowed”. The form in the product accepts CSV or XLSX by drag and drop, then asks for the format, the date field, date format, time zone and how to aggregate by time interval.
These forms are in the Sorba demo, which people can sign up for and download to try.
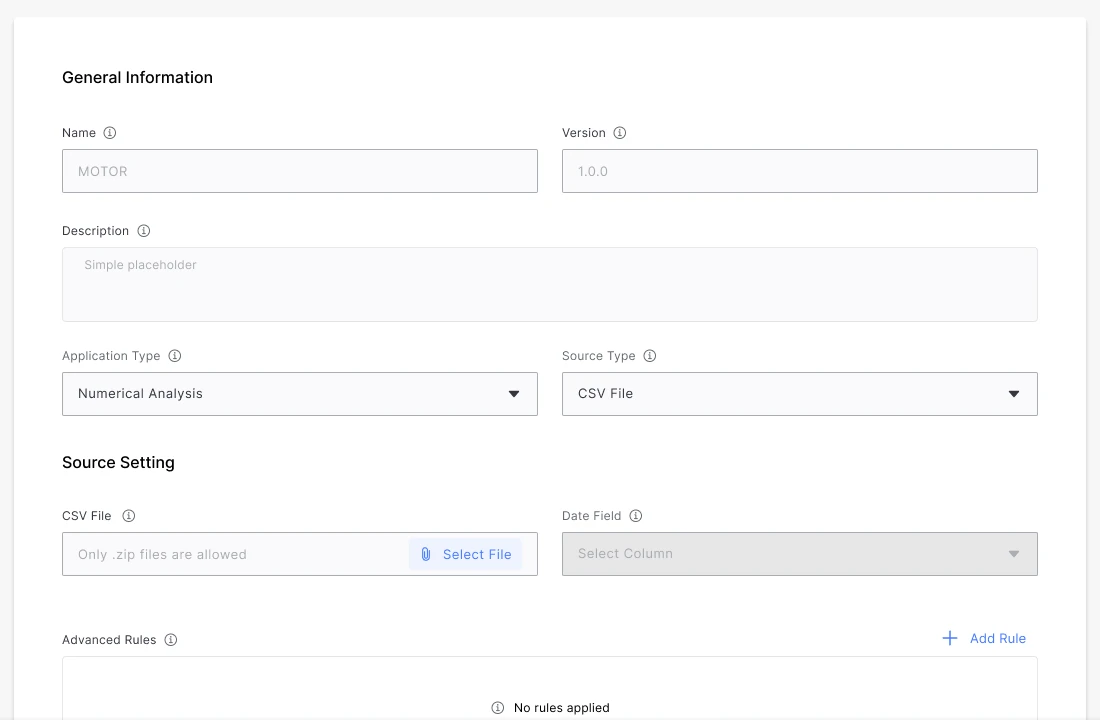
Earlier form
A file field labeled .zip only, a date column and an empty rules area.
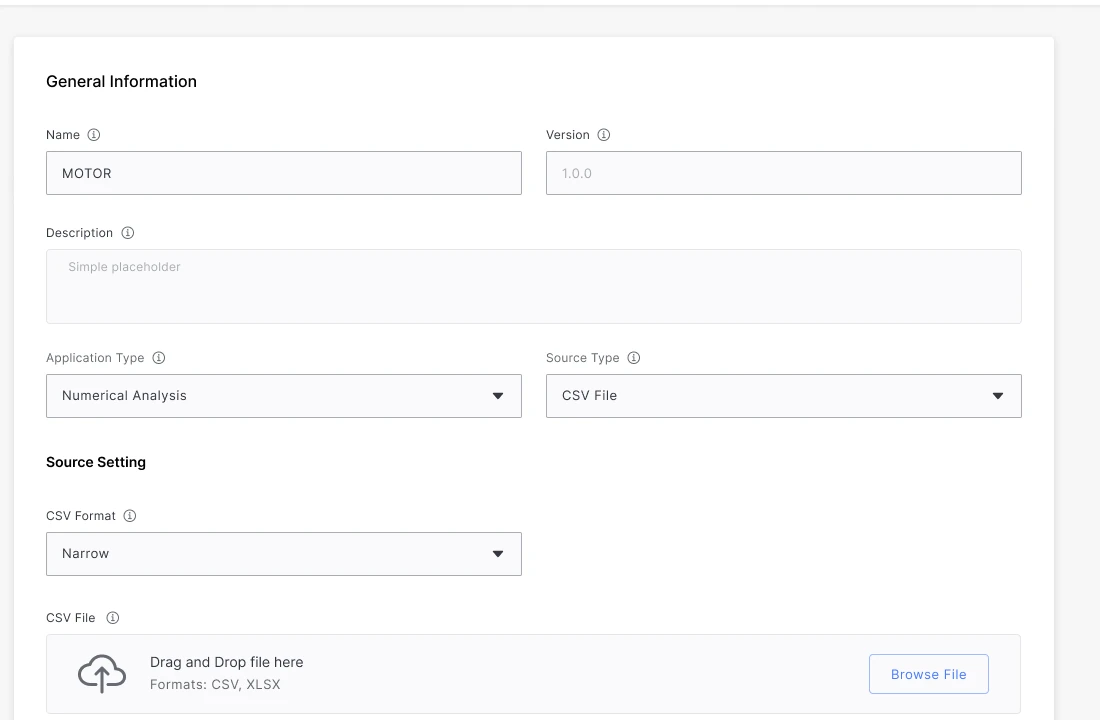
Form in the product
Drag and drop for CSV or XLSX, then format, date field, date format, time zone and aggregation.
Settings for every field.
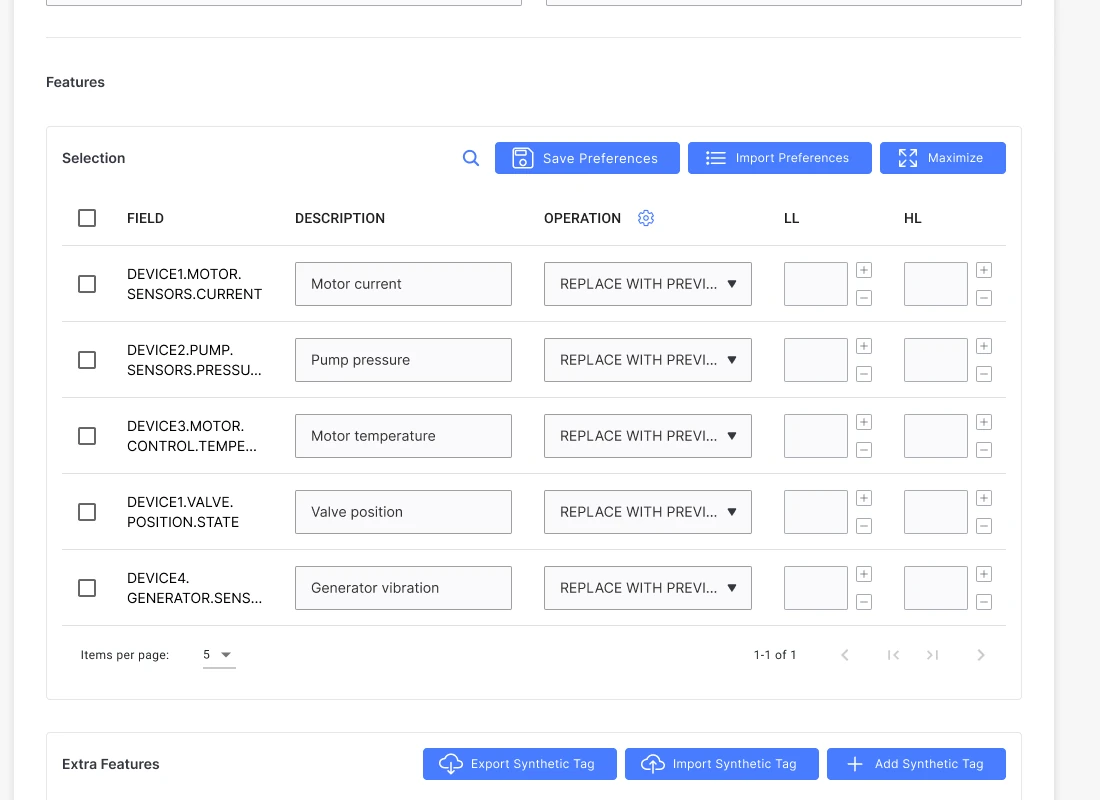
I kept each field’s operation beside its name, with options to replace or discard values and controls labeled LL and HL. Source settings, field operations and rules sit within one configuration form. Keeping them together makes the configuration visible, but the form remains long; I would test where people need more guidance or progressive disclosure.
Field preferences can be saved and imported; synthetic tags and advanced rules have separate tables with Export and Import controls.
Hot data source · in the product
Pick live data from a list or a query.
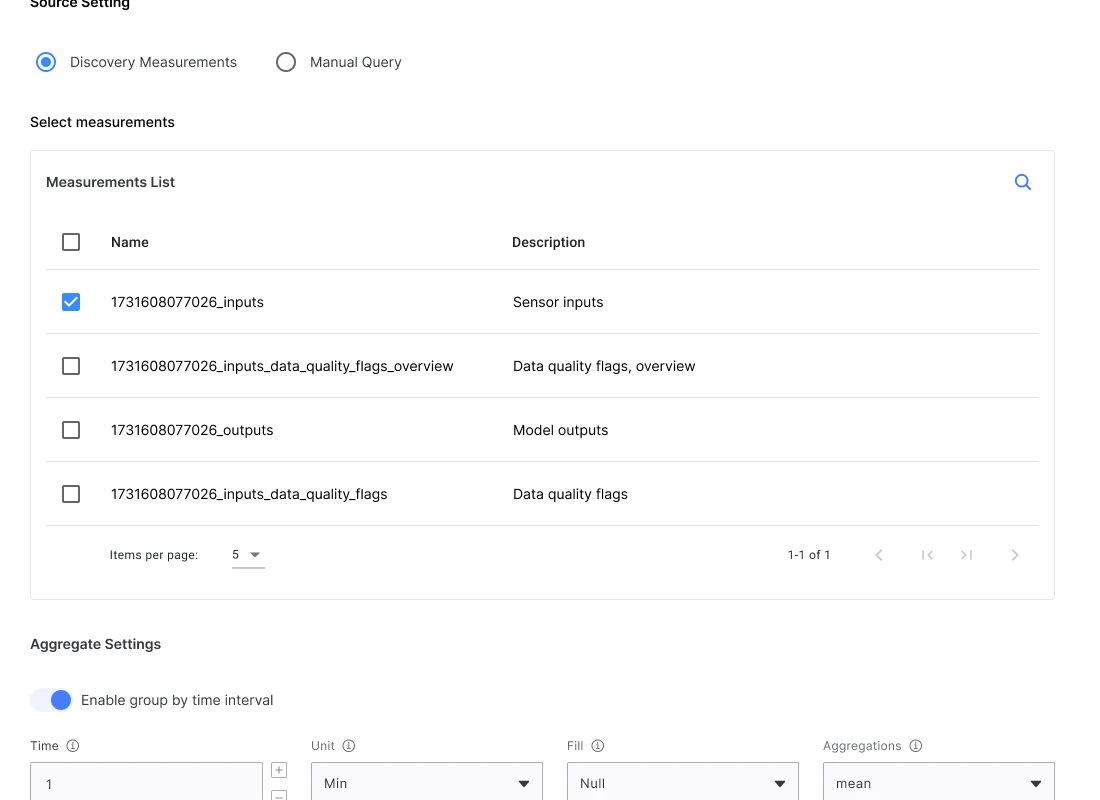
For live data, the form offers “Discovery Measurements”, a list of measurements to tick, or a “Manual Query”. The redesign turns that choice into a view toggle between a query editor and a table.
In the product
Two options and a measurements list with search and checkboxes.
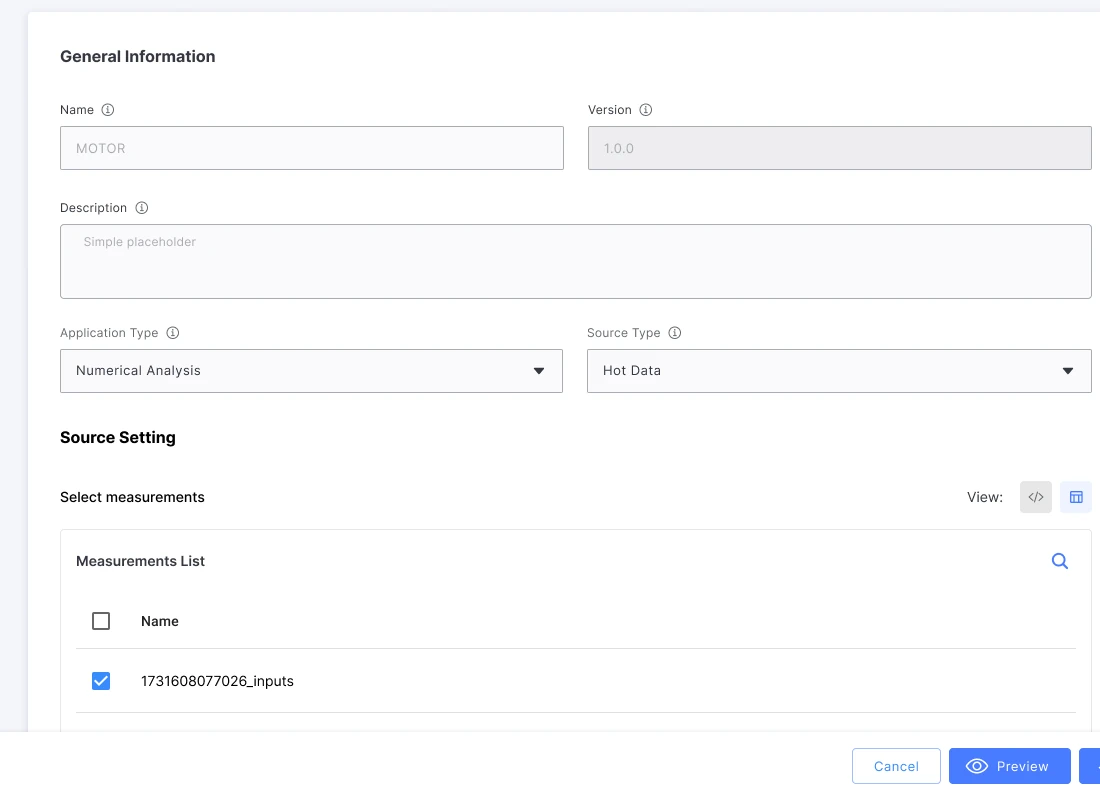
Redesign · table view
A toggle switches between this table and a query editor.
Rules and recovery · redesign proposal
Make the rule visible. Make mistakes clear.
Rules, the version-conflict message and the exit confirmation exist in the product in the earlier look. These screens show how I redesigned them.
A rule is more than a dropdown choice. The builder keeps its field, operation and value together, lists each condition and shows the resulting expression before saving, so the configuration can be inspected.
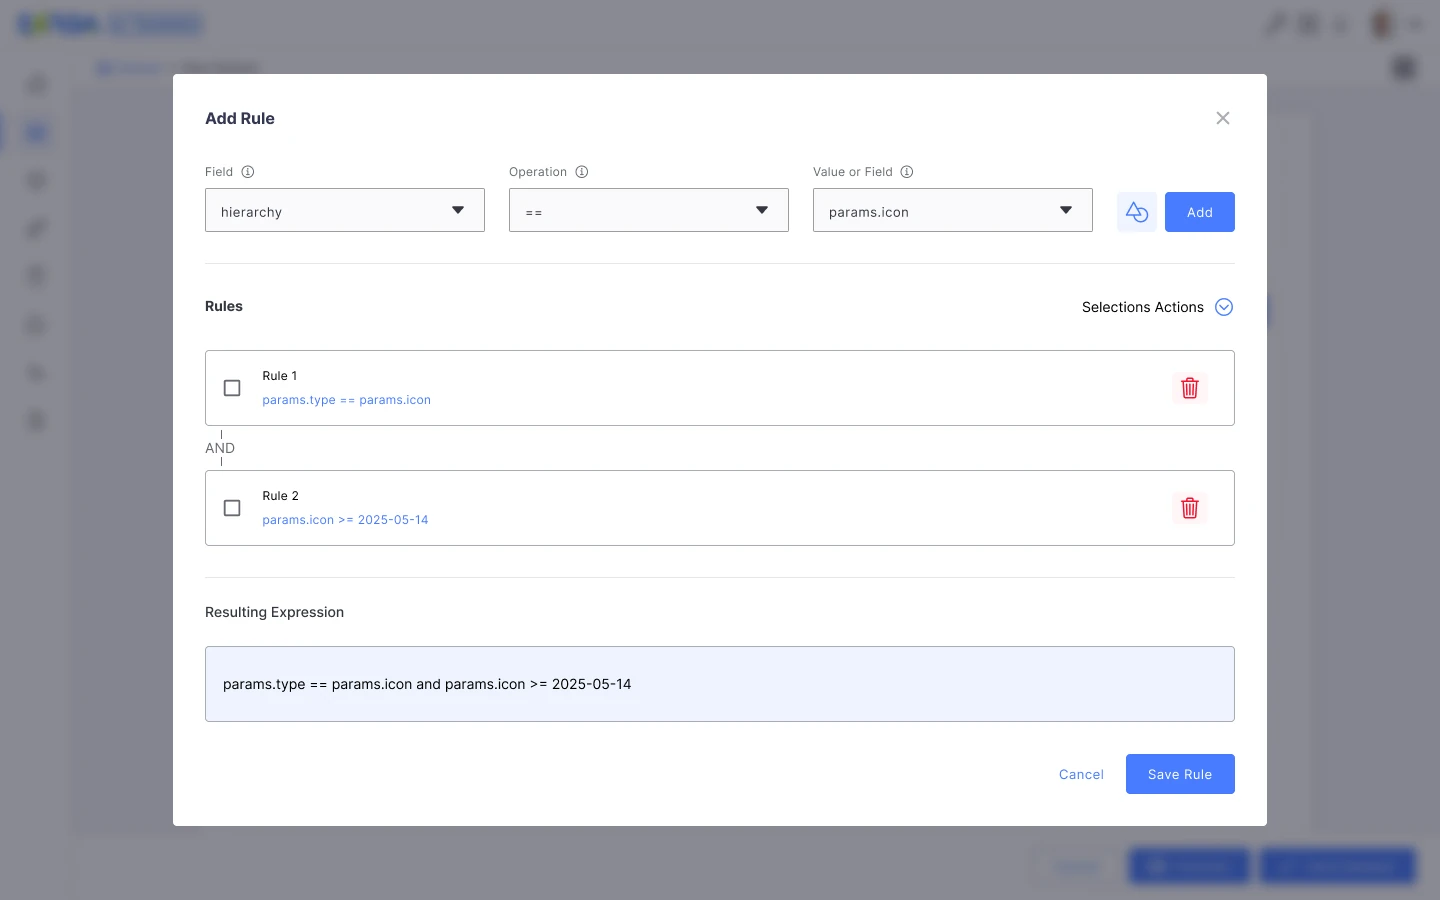
Rule builder
Each condition is listed, and the combined expression shows before Save Rule. The example values are illustrative, not validated business logic.
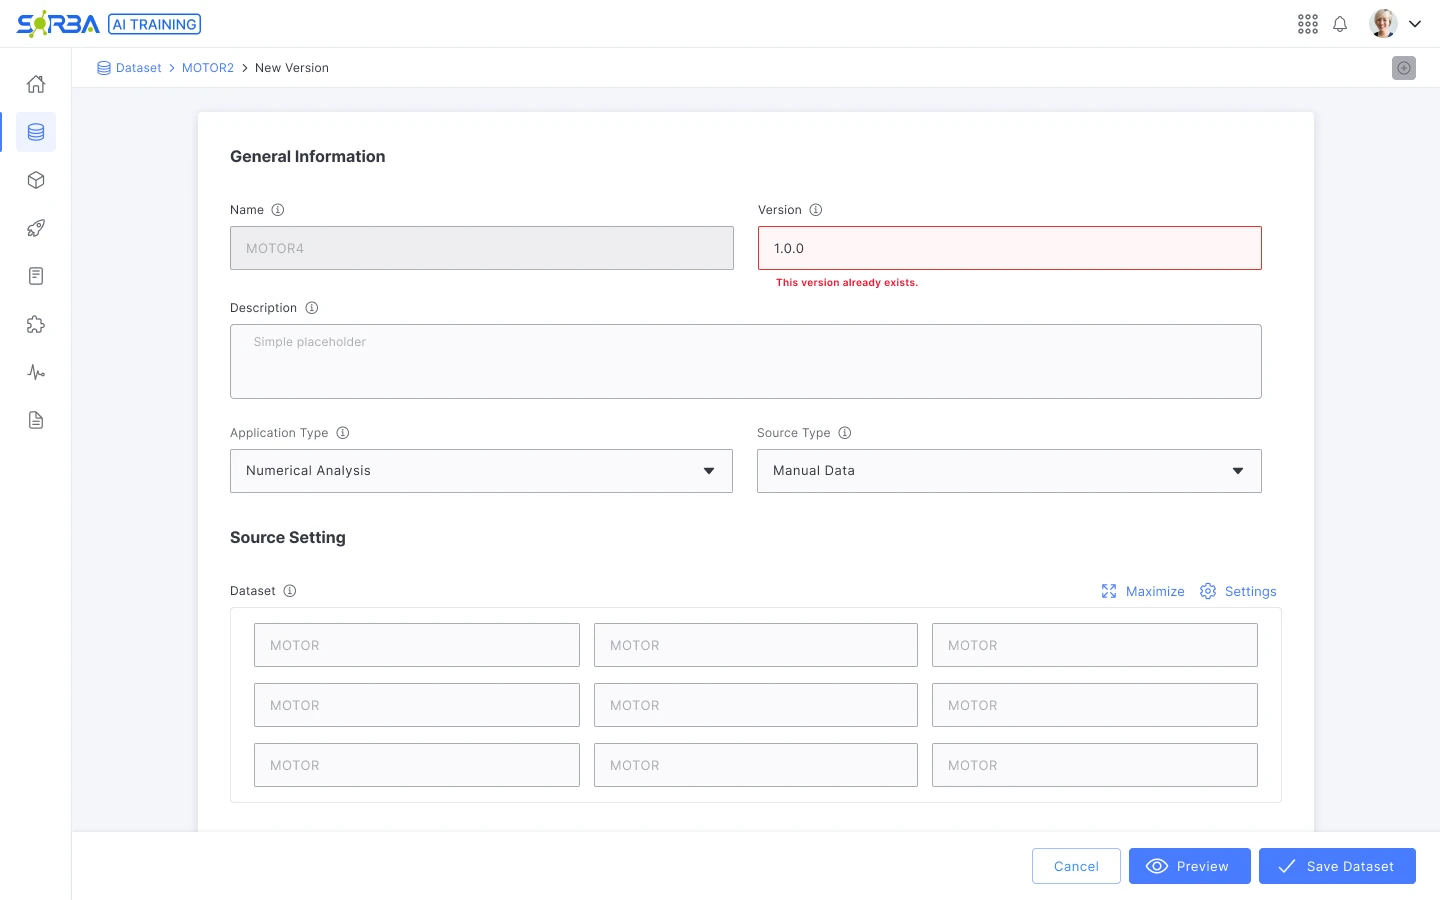
Version conflict
The version field says why the identifier cannot be reused.
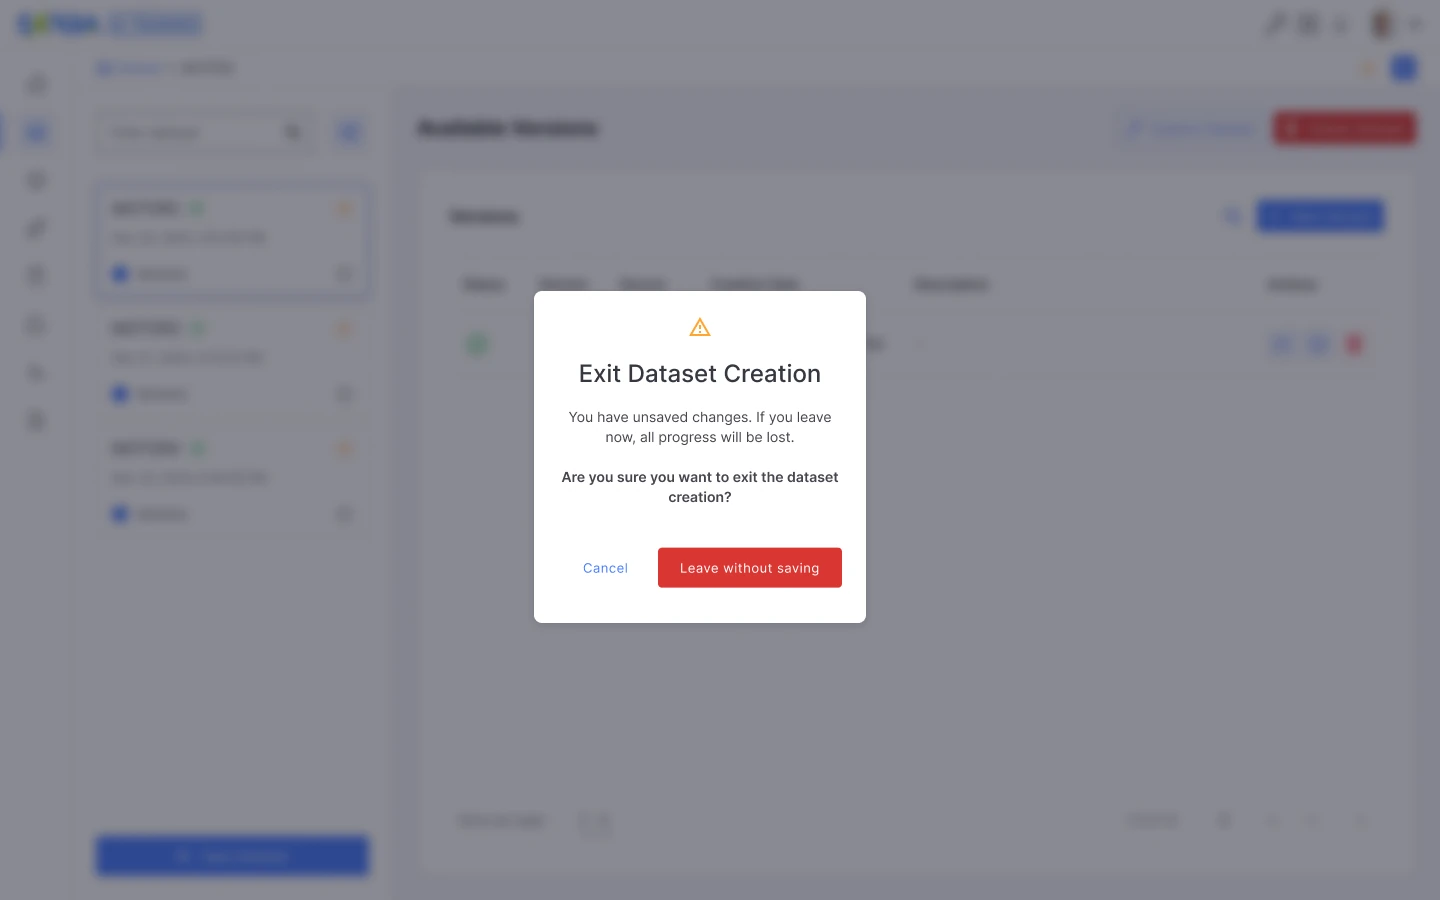
Leaving a form should be deliberate.
The exit dialog warns that unsaved changes will be lost. It uses “Cancel” for staying in the form, so I would test a clearer label such as “Keep editing”.
The saved forms show a Preview action, but no preview-result screen is included in this case.
Dataset module · redesign proposal
A clearer list of what you have.
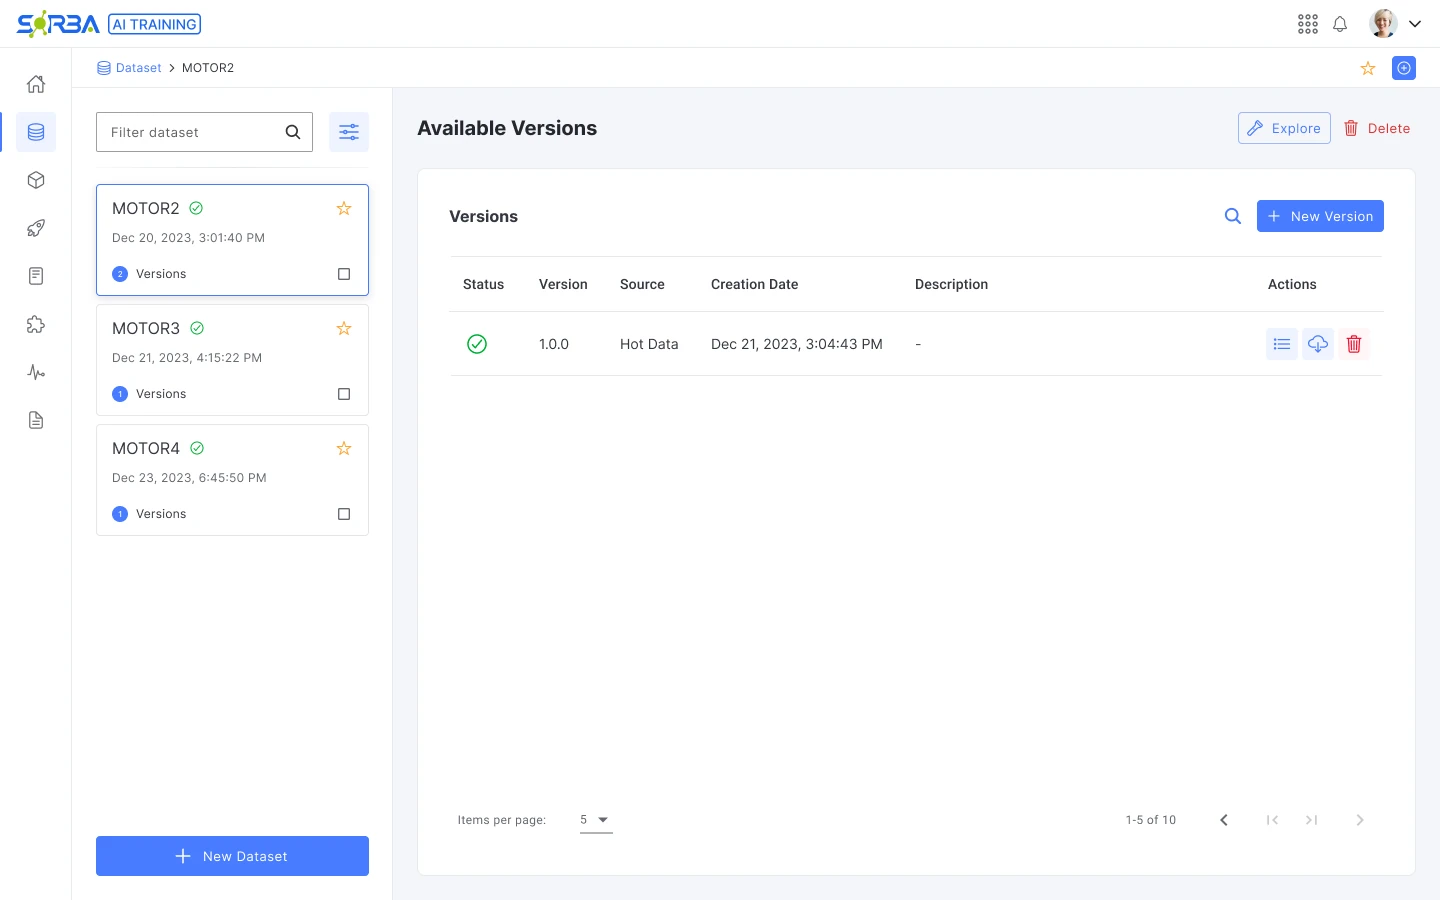
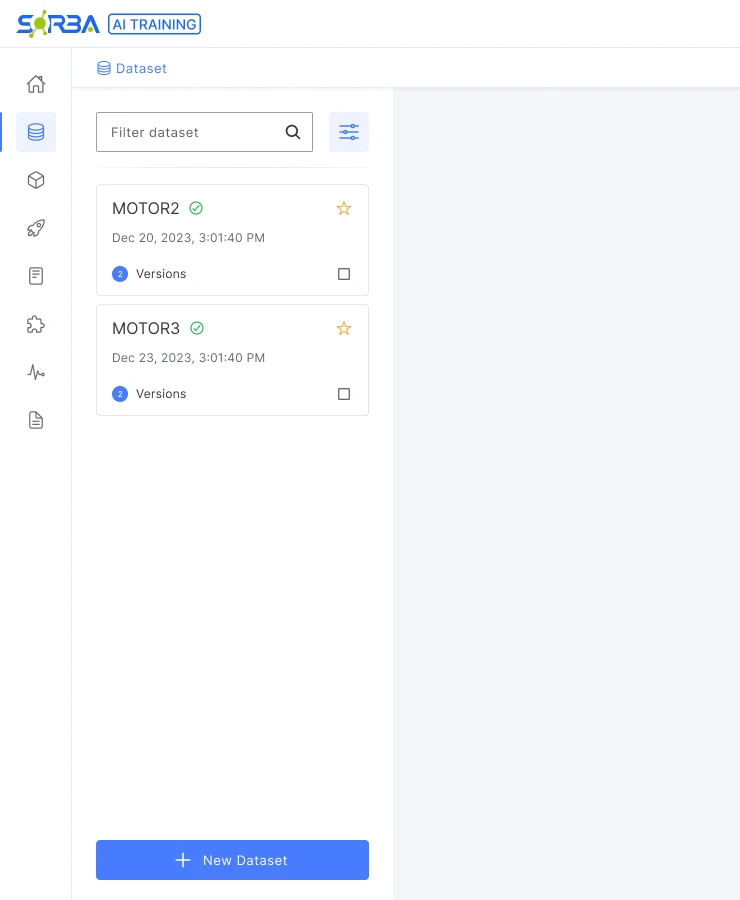
The dataset cards in the product already show a status icon and a favorite star. My proposal adds a numeric version count and a selection checkbox, while retaining the name and date.
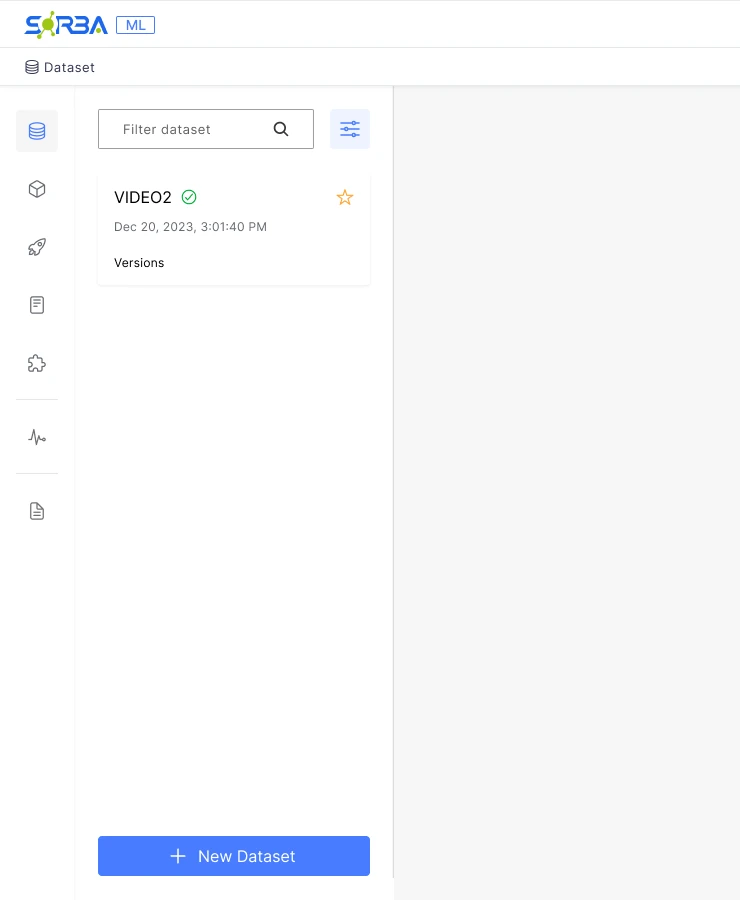
In the product
A dataset card with a name, date, status check, favorite star and Versions label.
Redesign proposal
The proposal adds a numeric version count and selection checkbox to the dataset cards.
Versions · redesign proposal
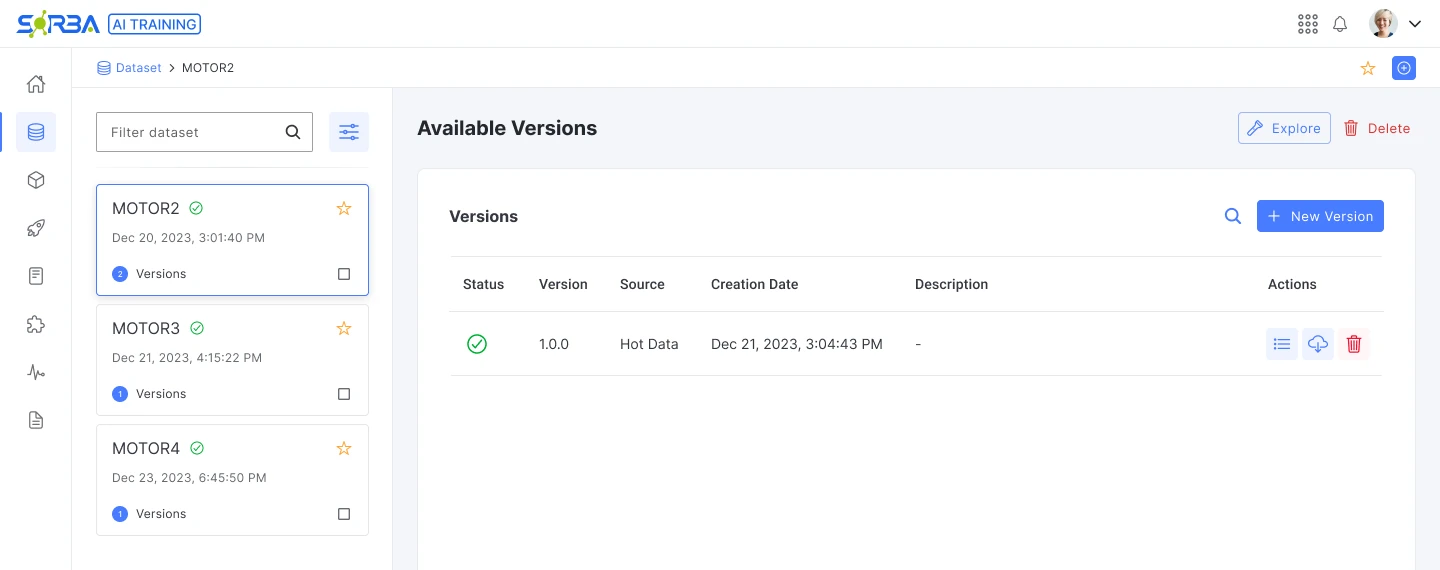
The dataset stays in view as versions change.
A dataset and its versions are different objects. In the proposal, the selected dataset stays in the list while its versions appear beside it. Version, source and creation date help tell entries apart, and “New Version” and “Explore” make the next actions explicit.
Dataset health · redesign proposal
Status you can read before you open it.
A dataset holds versions, and a version can fail on its own. The card shows a count of versions, and its colour and tooltip say what the count means: all good, one invalid version but still usable, or every version with issues.
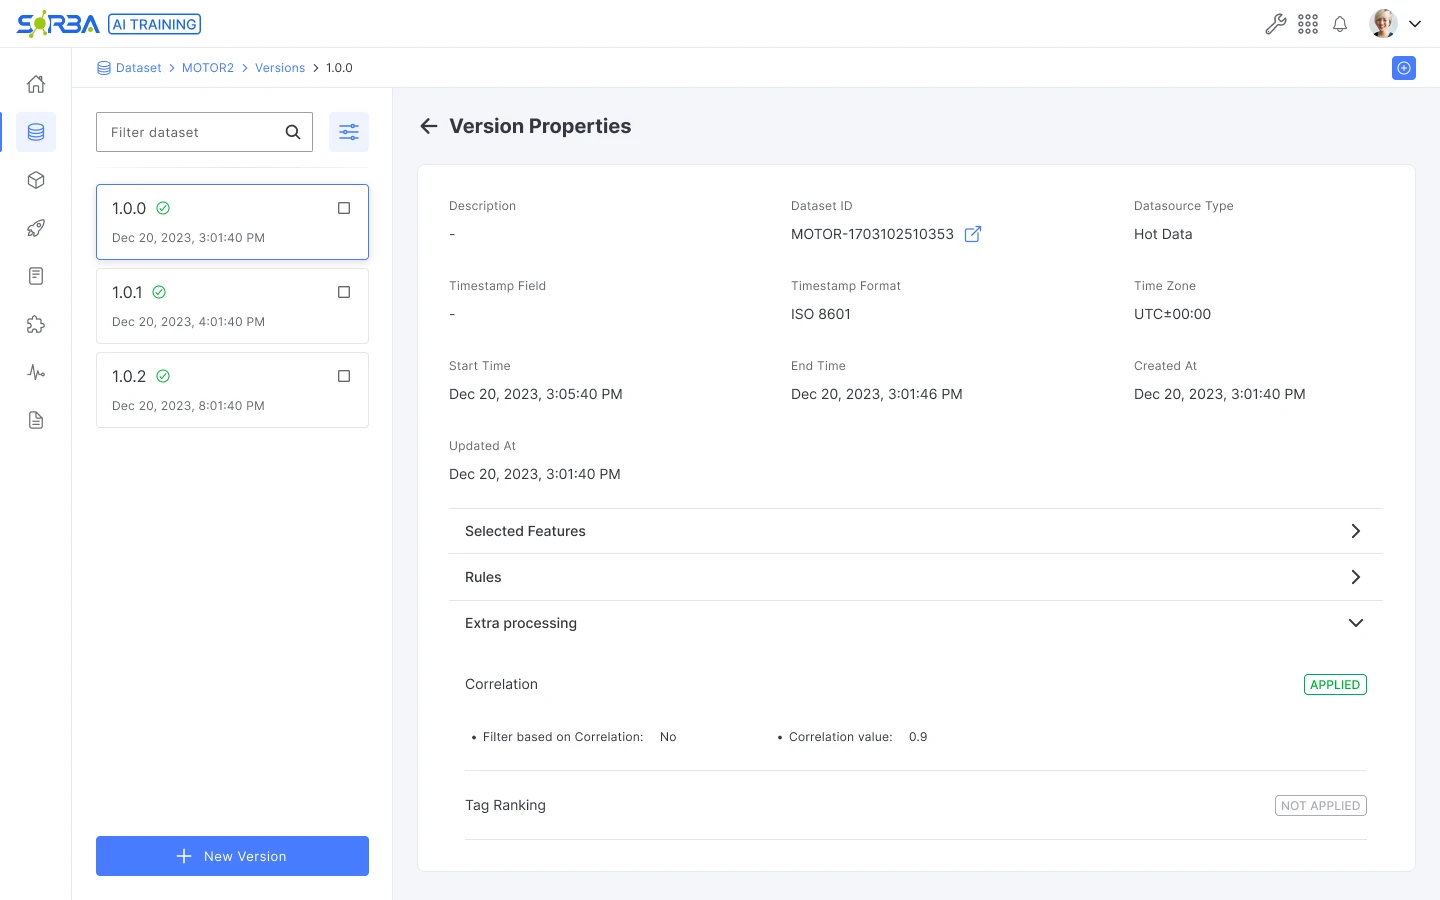
Version properties show which extra processing is marked APPLIED or NOT APPLIED.
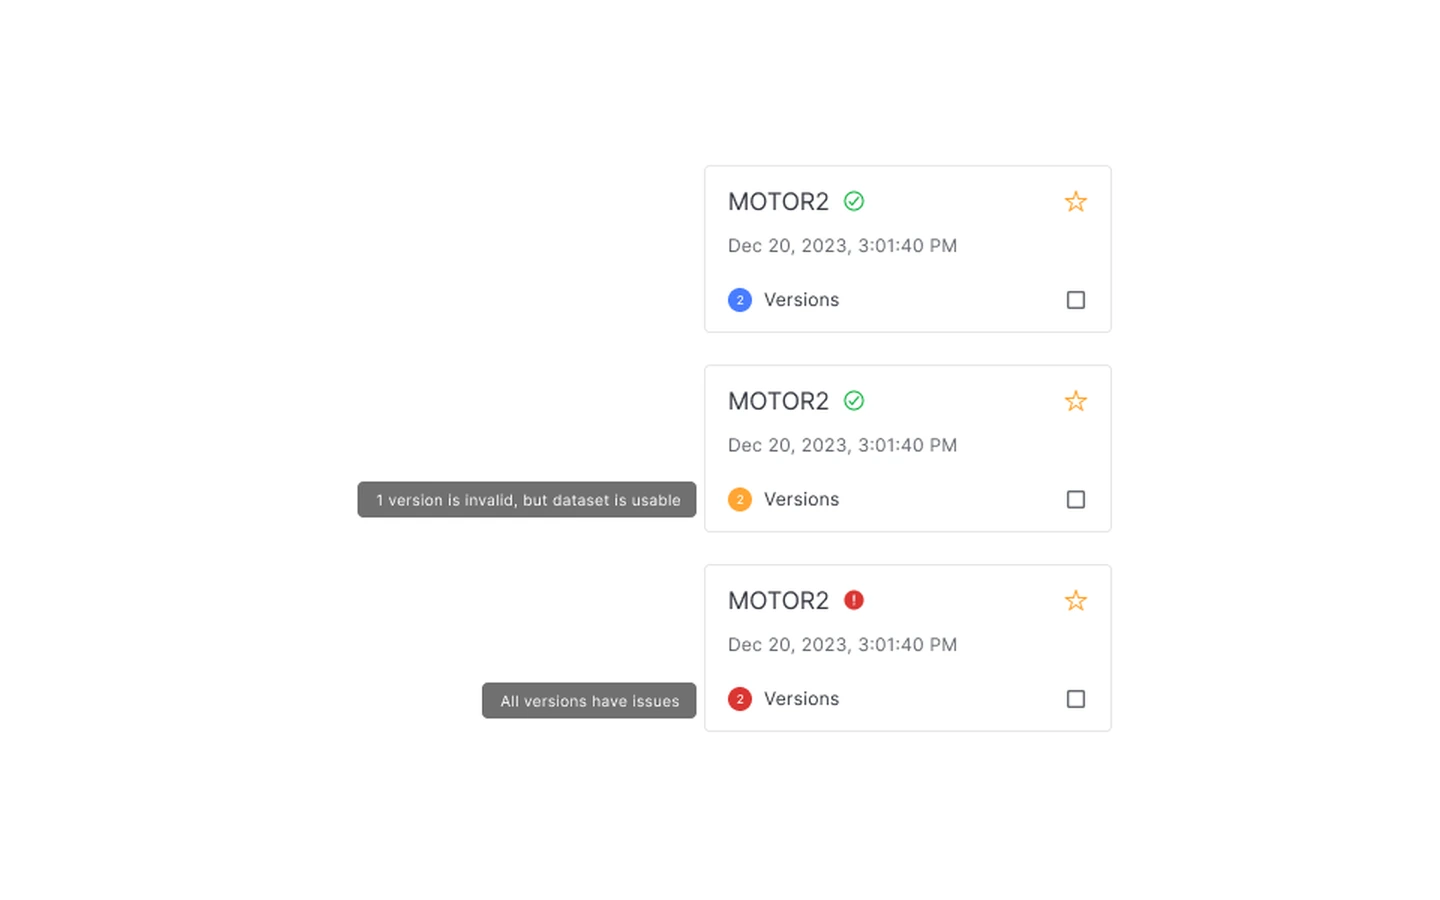
Three health states
The dataset card carries its state in an icon, the count colour and a tooltip.
Version properties
Source, time range and the processing applied, with APPLIED and NOT APPLIED chips.
Explorer and warnings · redesign proposal
Look before you train, think before you delete.
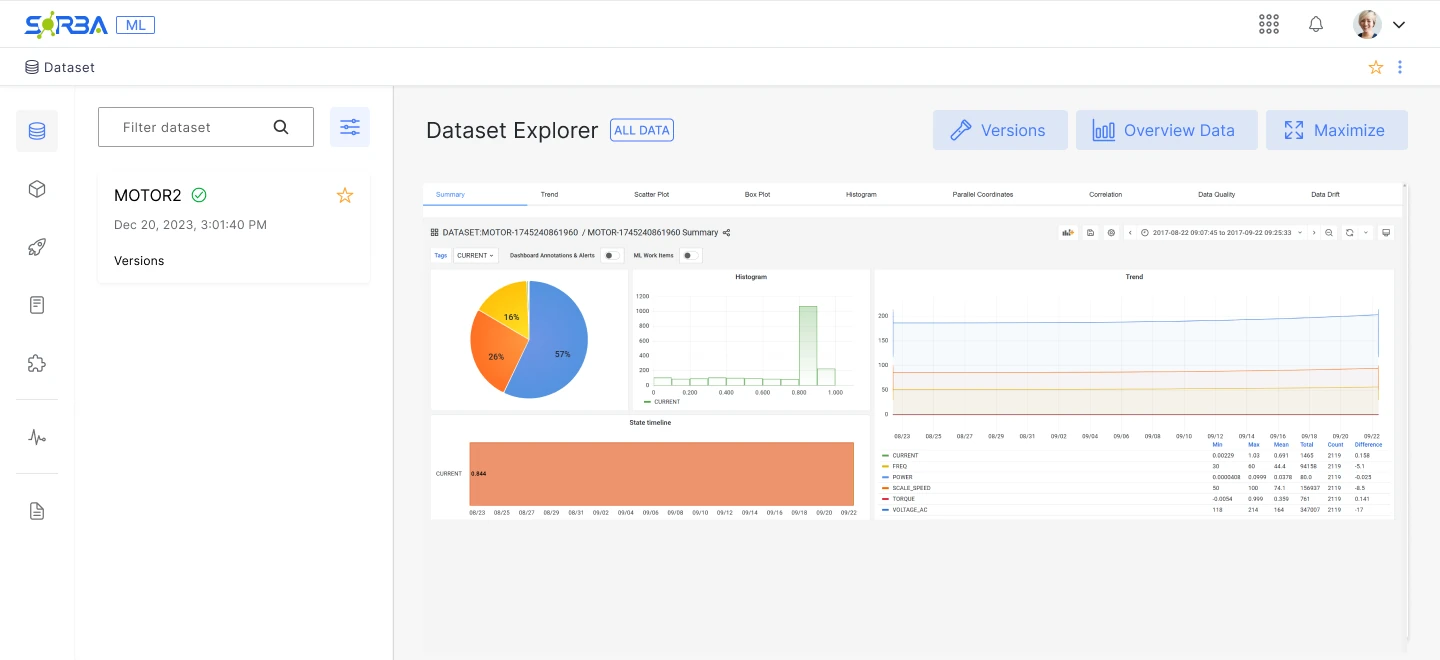
The explorer in the product opens a dataset’s data in a summary of charts. The proposal keeps the selected dataset beside the analysis tabs, so people can switch datasets without leaving the view.
The charts in these designs use sample data.
Explorer in the product
The all-data view, with sample data.
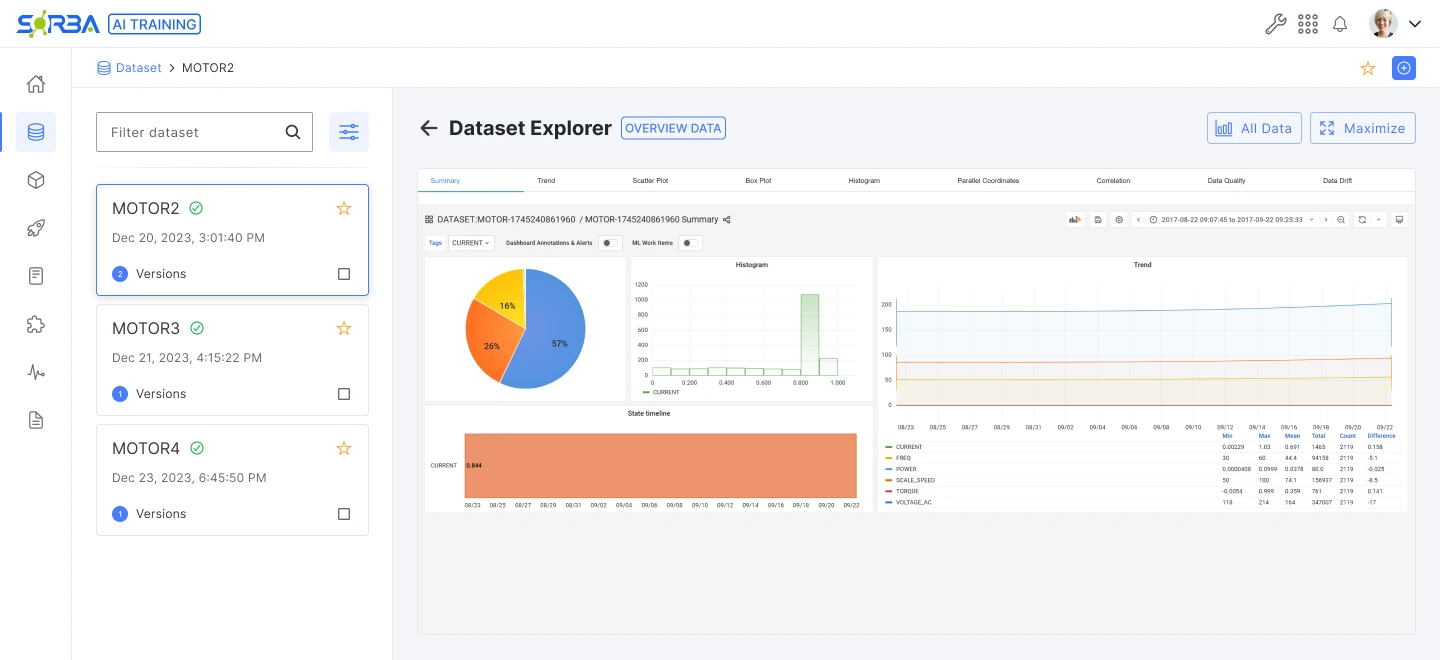
Redesign proposal
The dataset list stays beside the analysis views. Charts use sample data.
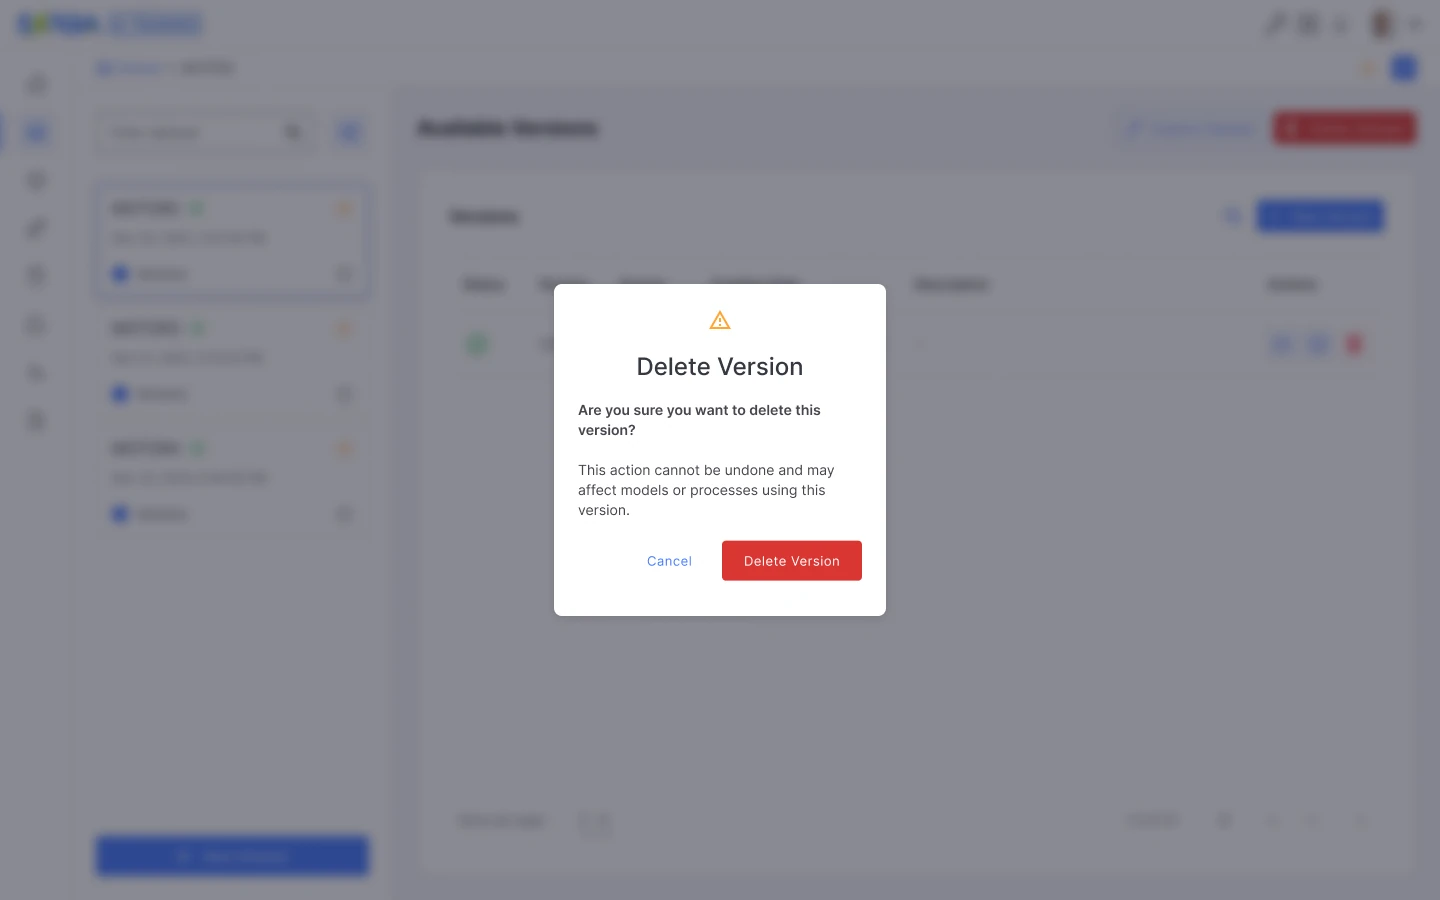
Think before you delete.
The proposed delete-version dialog warns that deletion cannot be undone and may affect models or processes using that version.
How I worked
Working quickly with internal feedback.
I designed new and revised forms, flows and a visual style, with feedback from developers testing the work and from the e-commerce team. The surviving screens show variants, but they do not provide a complete record linking feedback to individual changes.
Design outcome & reflection
Dataset forms in the demo. Module redesign proposed.
The new dataset forms are part of the Sorba demo. The redesigned overview, list, versions, explorer and warnings remain proposals, and the product still shows the earlier views there.
The new dataset forms and services changed daily work: shorter paths for tasks such as creating a dataset, with the options easier to find. I don’t have timings for this, so I don’t quote any.
The designs show how I structure a technical product and make its decisions visible: new forms, rules, versions, status and recovery states. Measuring errors, completion time and adoption is the next step.
The new forms and services made the dataset flows easier to follow: things are easier to find, and tasks like creating a dataset are simpler and shorter than before.
≈4
months, as the only product designer
2
layers: in the product, and a redesign proposal
What I would test next
Choose and configure a source
Can someone pick the right source and set the date and time options without help?
Explain a field operation or a rule
Can they describe the effect of an operation or a combined rule before saving?
Distinguish datasets, versions and recovery states
Can someone identify the selected dataset and version, recover from a naming conflict, and leave a form without losing work by accident?
I would observe task completion, errors, requests for help and how people read the saved configuration. Before implementation, I would also review contrast, form length, disclosure of advanced settings and whether status remains understandable without colour or hover. Developer discussion was technical input, not usability validation.
What I would do differently
Write it down as I go
Keep a short decision log per screen: the problem, the variants and what changed after feedback. That is the part this case cannot show.
Test with the people who prepare data
Watch someone import a file and create a dataset version; note where they stop or guess.
Review the proposal in stages
Review the proposed list and version-status views with the team, then test them before deciding what to build next.